> ## Documentation Index
> Fetch the complete documentation index at: https://docs.altrum.ai/llms.txt
> Use this file to discover all available pages before exploring further.
# AI System Reporting
> Understand how to access, filter, and analyse AI system performance and guardrail violation data
## Overview
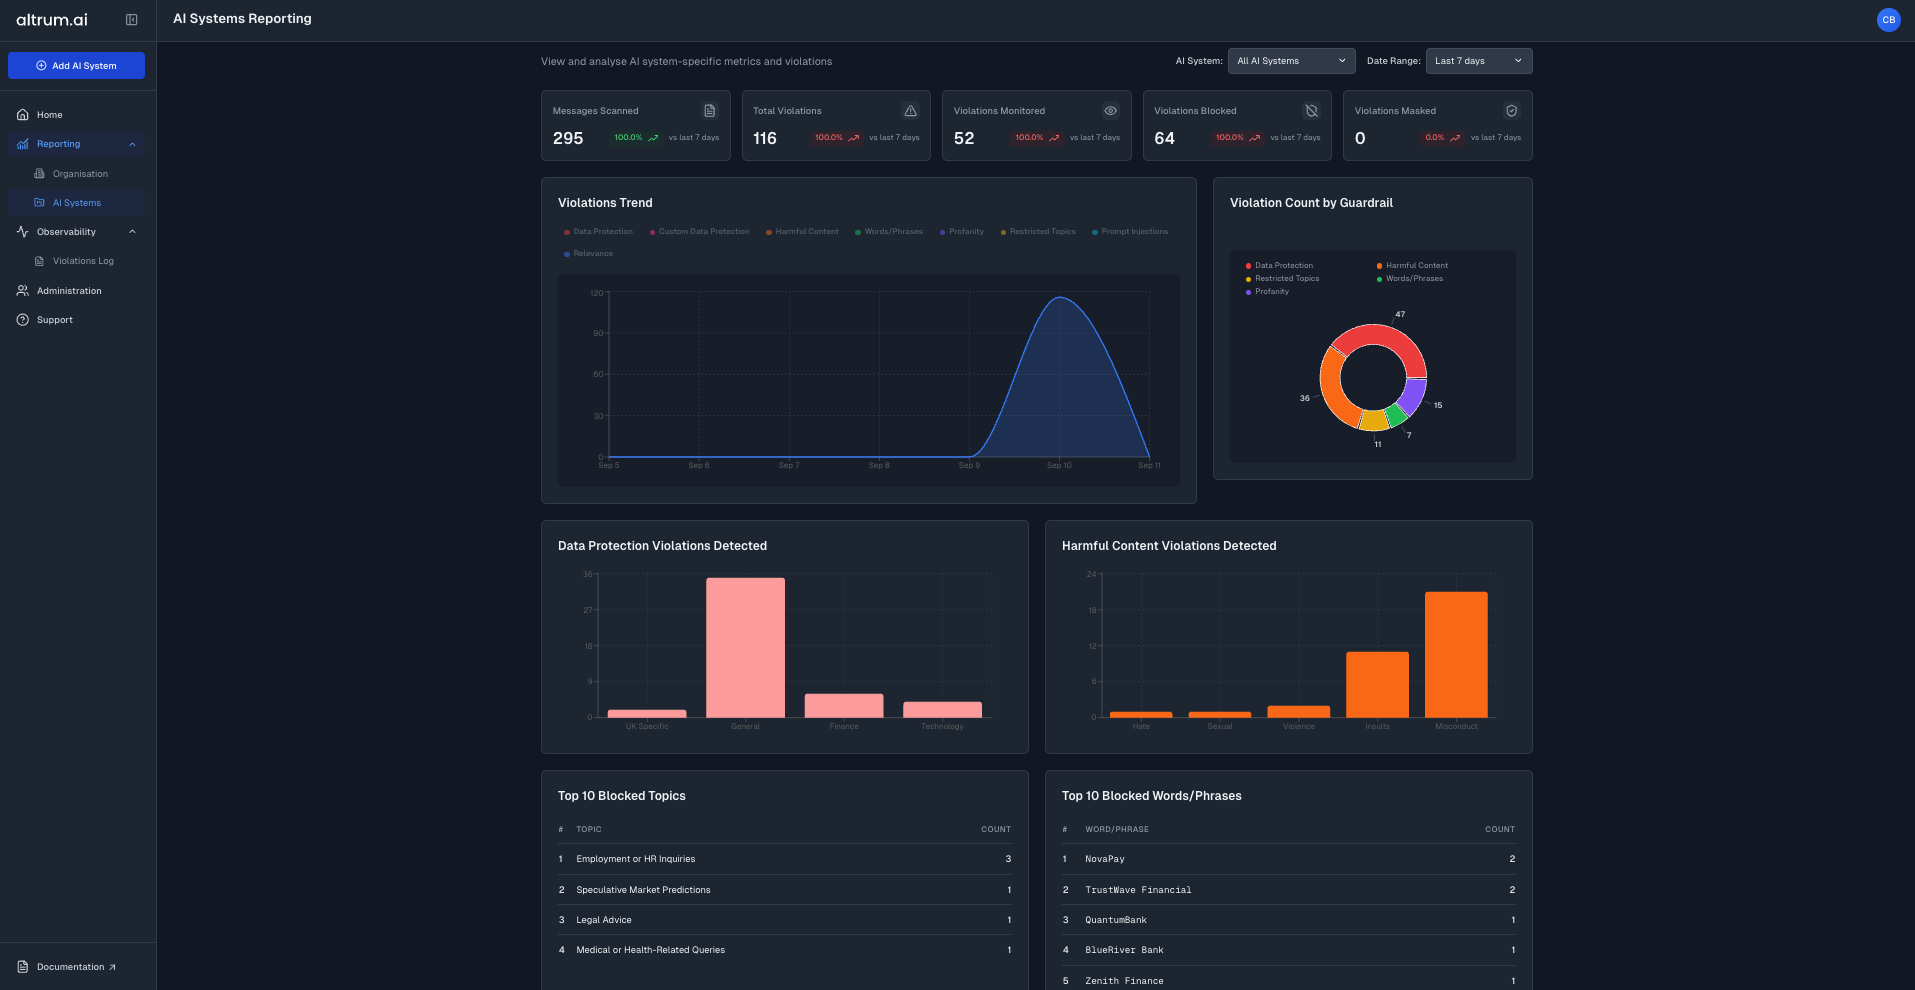
The **AI System Reporting** module provides real-time insights into the performance of your AI systems and the effectiveness of guardrail enforcement.
AI System Reporting enables you to track key usage statistics, monitor guardrail adherence, and identify trends over time empowering better governance and continuous improvement.
***
## Accessing the AI System Reporting Dashboard
1. From the **Navigation Panel**, click on the **Reporting** tab and select **AI Systems**
2. You will be directed to the **AI System Reporting Page**, where you can access detailed insights for your AI systems.
 ***
## Navigating the AI System Reporting Page
The AI System Reporting Page provides comprehensive metrics and analytics for your AI systems:
### AI System Filter
By default, **all AI systems** are selected and included in the reporting dashboard. To focus on specific AI systems:
1. Use the **AI System Filter** dropdown to select individual systems
2. Choose an AI systems to view their specific metrics and performance data
3. The charts and statistics will automatically update to reflect only the selected systems
### Key Metrics
* **Usage Statistics**: Track request volume, response times, and model performance
* **Guardrail Violations**: Monitor compliance and identify potential issues
* **Performance Trends**: Analyse patterns over time to optimise system performance
### Time Filter Options
* **Last 7 Days**
* **Last 30 Days**
* **Last 90 Days**
* **Year to Date**
Selecting a timeframe will automatically update the statistics and visualisations.
***
## Best Practices
* **Regular Monitoring**: Check the AI System Reporting Dashboard regularly to ensure continuous compliance
* **Trend Analysis**: Use time filters to identify patterns and spot early warning signs
* **Performance Optimisation**: Monitor usage patterns to optimise costs and performance
***
## Next Steps
Update and adjust guardrail settings for better oversight.
Access detailed violation logs and audit trails.
***
## Navigating the AI System Reporting Page
The AI System Reporting Page provides comprehensive metrics and analytics for your AI systems:
### AI System Filter
By default, **all AI systems** are selected and included in the reporting dashboard. To focus on specific AI systems:
1. Use the **AI System Filter** dropdown to select individual systems
2. Choose an AI systems to view their specific metrics and performance data
3. The charts and statistics will automatically update to reflect only the selected systems
### Key Metrics
* **Usage Statistics**: Track request volume, response times, and model performance
* **Guardrail Violations**: Monitor compliance and identify potential issues
* **Performance Trends**: Analyse patterns over time to optimise system performance
### Time Filter Options
* **Last 7 Days**
* **Last 30 Days**
* **Last 90 Days**
* **Year to Date**
Selecting a timeframe will automatically update the statistics and visualisations.
***
## Best Practices
* **Regular Monitoring**: Check the AI System Reporting Dashboard regularly to ensure continuous compliance
* **Trend Analysis**: Use time filters to identify patterns and spot early warning signs
* **Performance Optimisation**: Monitor usage patterns to optimise costs and performance
***
## Next Steps
Update and adjust guardrail settings for better oversight.
Access detailed violation logs and audit trails.